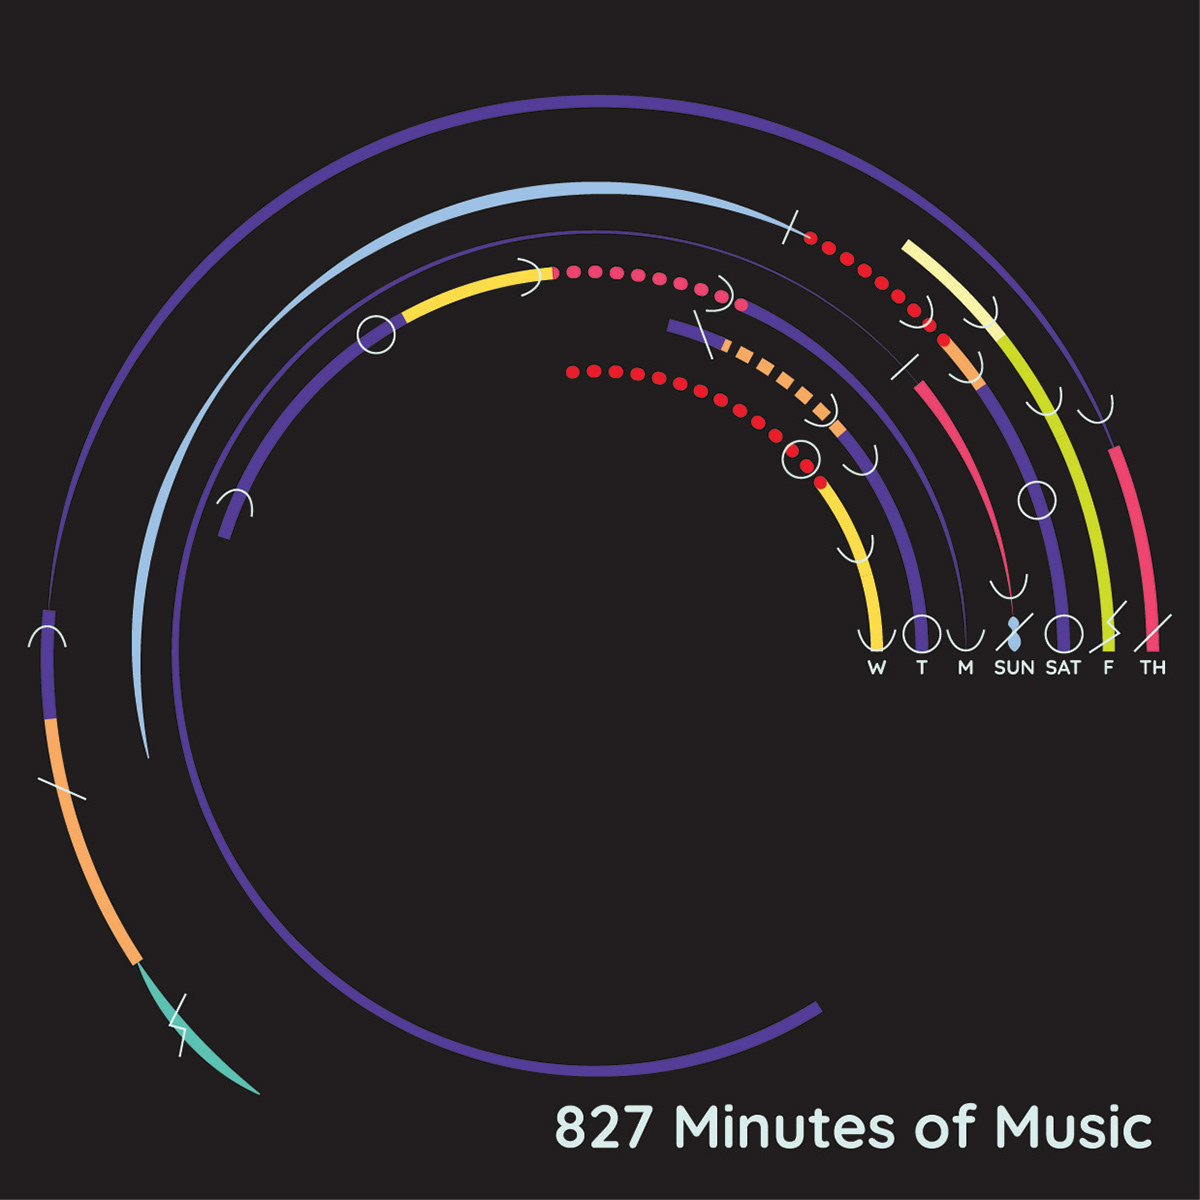
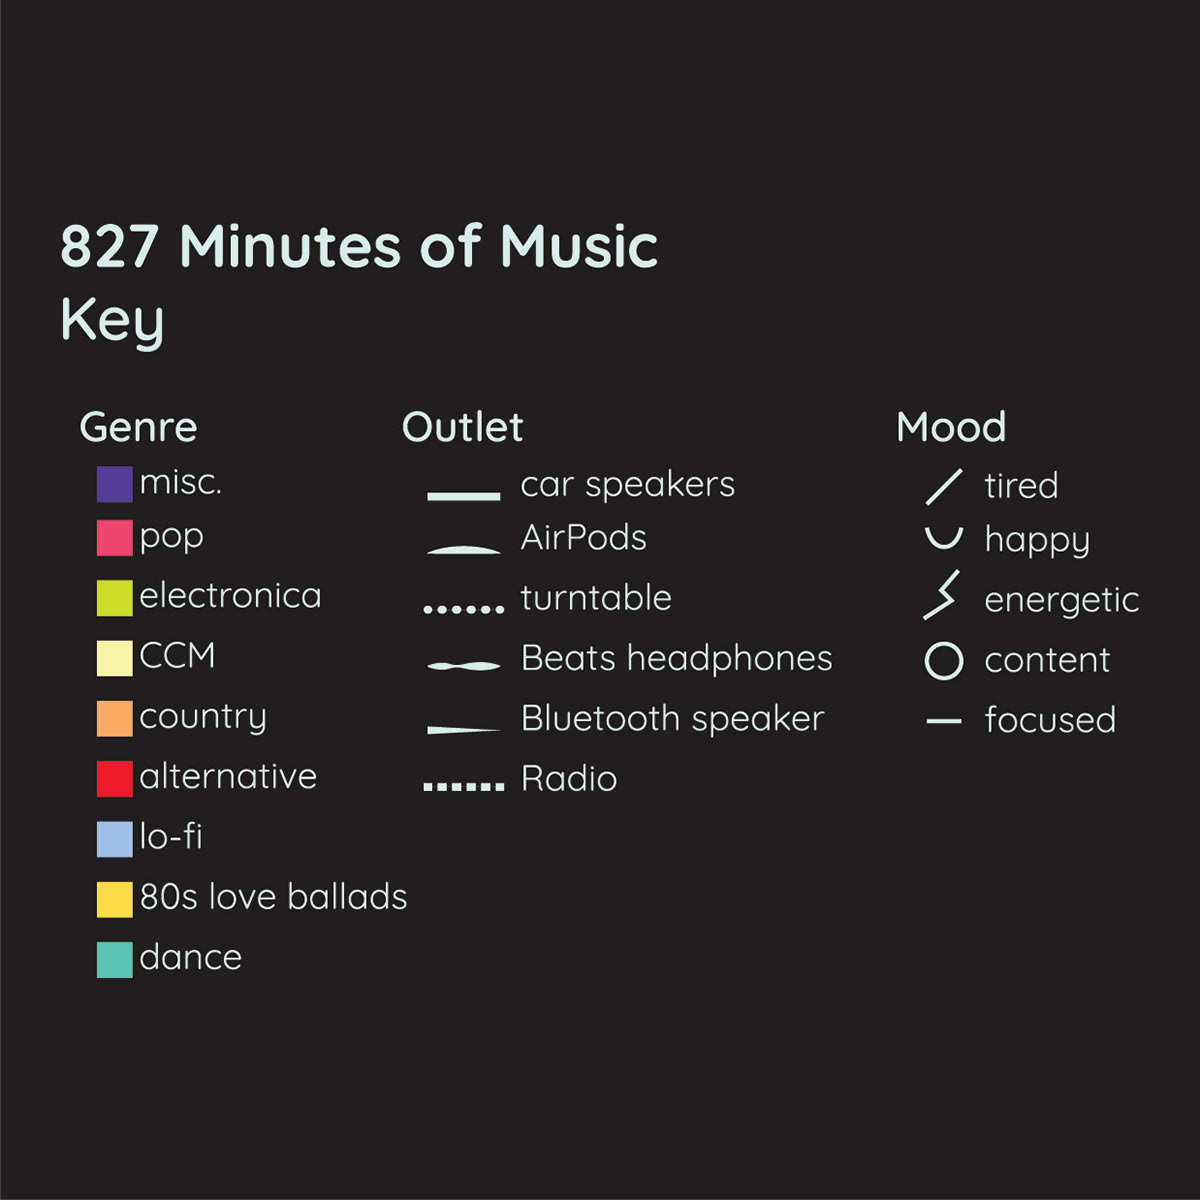
Throughout the duration of three weeks, each week I collected data about my habits or occurrences in my everyday life. The main challenge, or goal, of this project was to represent this data in a chart in an engaging manner. I designed each data visualization differently according to the subject, and utilized textures, patterns, illustrations, and varying typography to to achieve this goal.


